Imagine that there are two jars in front of you, both filled with a certain chemical solution. These compounds are completely different from each other, yet to the naked eye, they look identical.
How can you tell what each substance is in the safest, fastest, and most accurate way possible?
The answer is absorption spectroscopy — a scientific method that can determine the chemical composition of a solution by measuring how this solution absorbs electromagnetic radiation.
There are several different methods of absorption spectroscopy based on the exact types of radiation it measures. In this article, we will focus on ultraviolet-visible or UV-vis spectroscopy and explain what it is, how it works, what its practical applications are, and more.
What Is UV-Vis Spectroscopy?
UV-vis spectroscopy or spectrophotometry is a type of absorption spectroscopy that measures how much ultraviolet or visible light a certain molecule absorbs to determine its chemical composition.
To give you a better idea of what this means, let’s take a step back and explore the basic principles behind absorption spectroscopy.
Principles of Absorption Spectroscopy
Absorption spectroscopy is a quantitative chemical analysis method based on the Beer-Lambert Law. According to this law, the absorption of visible light passing through a certain substance is proportional to the concentration of that substance.
In other words, the more concentrated a substance is, the more light it will absorb.
Another key concept behind all types of absorption spectroscopy is the electromagnetic spectrum, from which spectroscopy borrows its name.
The electromagnetic spectrum includes all types of electromagnetic radiation known to science, arranged by their respective frequencies — from low-frequency radio waves to extremely high-frequency gamma rays.
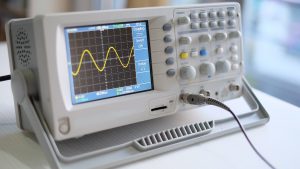
Electromagnetic radiation exhibits a specific frequency because it behaves like repeating waves that oscillate between their high and low points.
Imagine a military radio wave monitor or a heart rate monitor to visualize what this behavior looks like.
The frequency determines how quickly the wave oscillates between its high and low points. The lower the frequency, the more distance the wave travels between the two points. This distance is also known as wavelength.
In other words, the frequency and the wavelength of electromagnetic radiation are inversely proportional to each other.
Low-frequency radiation, such as radio waves, has a very long wavelength, which places it at the low energy portion of the electromagnetic spectrum. Such radiation has a very low intensity, or energy per photon.
Meanwhile, high-frequency radiation, such as gamma radiation, has an extremely short wavelength and high energy per photon. Rather than being absorbed by obstacles, gamma rays simply penetrate them, ionizing the obstacle’s particles along the way.
This is what makes gamma rays so dangerous to humans: they can easily penetrate skin, organs, and soft tissue and break down the DNA molecules in each cell they encounter. This causes the cells to either die or start malfunctioning, which often leads to cancer or other lethal cell mutations.
However, there are many types of electromagnetic radiation that sit between the low-frequency radio waves and the high-frequency gamma rays on the electromagnetic spectrum. Each one of these types corresponds to a specific frequency range, including the light visible to the human eye.
But most importantly, each type of electromagnetic radiation interacts differently with different chemical elements, depending on the exact wavelength. Some elements can only fully absorb the radiation of a certain wavelength, while any shorter or longer waves simply pass right through without being absorbed.
The best example of this is an x-ray exam. The high-frequency x-ray waves pass freely through your skin, muscles, and soft tissue. However, they cannot penetrate your bones quite as well because your bones are denser and end up stopping (or absorbing) some of the x-rays. This allows the x-ray machine to create an image of your internal body structures.
Back to UV-Visible Spectroscopy
In terms of its basic operating principle, UV-vis spectroscopy is not particularly different from an x-ray exam you might undergo after breaking your ankle — except that a certain chemical compound takes the place of your leg, and ultraviolet/visible radiation takes the place of x-rays.
This type of spectroscopy is known as ultraviolet-visible because of the electromagnetic radiation wavelengths at which it operates typically range from 200nm to around 1,000nm.
With the electromagnetic spectrum in mind, this means that UV-vis spectroscopy includes the entire range of ultraviolet waves, which have a length of 200-400nm, as well as the entire visible right range, which spans from 390 to 700 nm.
How Does UV-Vis Spectroscopy Work?
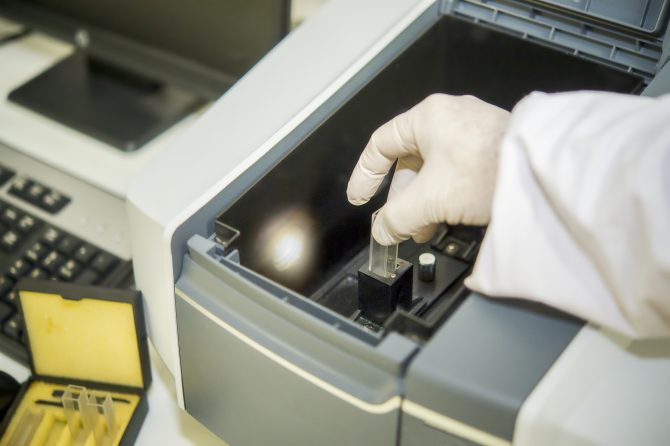
UV-vis spectroscopy is performed using a device called a UV-vis spectrophotometer. In its most rudimentary form, a spectrophotometer consists of the following elements:
- Light source, typically a deuterium or tungsten lamp which emits the light within the given wavelength range
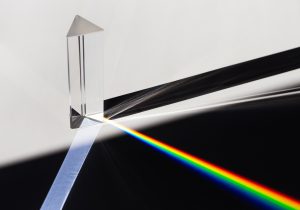
- Wavelength selector, also known as a monochromator which functions as a prism and separates the light that the lamp emits into specific wavelengths
- Cuvette, a small container which houses the substance that is being analyzed
- Photodetector, a light sensor that receives and processes the light as it passes through the sample in the cuvette
This is the most basic spectrophotometer design, also known as a single-beam spectrophotometer. However, there are more complex designs that can further expand the spectroscopy process:
- Double-beam spectrophotometers include a set of mirrors and a second cuvette for a reference sample. The mirrors split the light beam in two, which allows for the substance under examination to be tested along with the reference sample for improved accuracy.
- Simultaneous spectrophotometers don’t have a wavelength selector or a regular photodetector. Instead, they feature a diode array detector that measures the absorbance of all wavelengths as they pass through the sample at the same time.
Some spectrophotometers also include additional filters that can be attached to the wavelength selector to eliminate the unwanted wavelengths during the procedure.
Because the air itself can act as a filter and somewhat block the high-frequency UV waves, UV-vis spectrophotometers are usually filled with an inert gas, such as argon.
Regardless of the exact design used in a UV-vis spectrophotometer, the spectroscopy procedure typically goes as follows:
- First, a blank sample is analyzed in the spectrophotometer to calibrate the device for an accurate reading. This blank sample only contains the solvent that will be used to prepare the actual sample solution.
- Once the spectrophotometer has been calibrated, the actual sample solution is prepared using the test substance and the solvent. The most commonly used UV-vis spectroscopy solvents include acetone, benzene, and dimethylformamide, as they have the highest UV light absorbance cutoffs. The absorbance cutoff is a specific wavelength below which all the light is absorbed by the solvent. For instance, benzene has a cutoff of 329nm, which is just above the long-wave UV or UV-A spectrum threshold.
- The prepared solution is then placed in the cuvette, which is typically made from fused quartz in UV-vis spectrophotometers. The reason for this is that quartz has a high absorbance cutoff of >380nm and won’t absorb the UV wavelengths, unlike glass or plastic.
- Once the sample is in place, the analysis procedure can be initiated. During the procedure, the light source sends a light beam through the wavelength selector and the sample. In UV-vis spectroscopy, the light source is usually a single xenon lamp that is capable of both UV and visible light wavelengths. However, some UV-vis spectrophotometers implement a dual light source solution — a tungsten or halogen lamp, which emits the visible light, and a deuterium lamp, which emits the UV light.
- After passing through the sample, the light beam is received by the photodetector. The photodetector interprets how much light was absorbed by the sample and visualizes it in an analysis report. The report, also known as the absorption spectrum, is a graph that maps how much light was absorbed by the sample at specific wavelengths.
Benefits of Ultraviolet Visible Spectroscopy in Chemical Analysis
UV-vis spectroscopy has several unique benefits compared to not only other types of chemical analysis but also to other types of spectroscopy.
These benefits make UV-vis spectroscopy the preferred chemical analysis method in many different scenarios — which we’ll cover shortly.
The key benefits of using UV-vis spectroscopy include:
- UV-vis spectroscopy is non-invasive and non-destructive, which makes it ideal when analyzing precious or scarce samples. After the procedure, most solutions and compounds can be used as intended.
- The UV-vis spectroscopy process is very quick, only taking a few minutes with preparations.
- UV-vis spectroscopy is extremely accurate and sensitive, which can be crucial in safety-related testing.
- UV-vis spectrophotometers are relatively inexpensive, compact, and easy to use. They are highly automated and don’t require extensive training.
UV-Vis Spectroscopy Applications [Examples]
Because of its accuracy and accessibility, UV-vis spectroscopy is widely used in a variety of industries and scenarios.
Let’s take a detailed look at some of these scenarios, including specific examples of how UV-vis spectroscopy can be applied.
Food & Beverage Analysis
If you are in the food and beverage industry, two of your primary concerns may be the safety and legislative compliance of your products.
In other words, ensuring that your products do not contain any foreign substances that can pose a danger to consumer health. Or, if your products contain regulated substances, such as caffeine or alcohol, ensuring that the concentration is within specific limits.
As such, UV-vis spectroscopy is often used in the food and beverage industry to measure the concentration of such substances in products. For example, if you manufacture coffee, you can easily determine just how much caffeine your latest batch of green coffee beans contains by extracting it from the beans using dichloromethane, dissolving it in water, and running the solution through a UV-vis spectrometer.
By comparing the results to caffeine’s reference absorption spectrum of 243–302nm in water at room temperature, you can determine the percentage of caffeine in your green coffee beans.
Medical Analysis
UV-vis spectroscopy is also widespread in medical analysis — particularly when analyzing the purity of DNA and RNA samples.
Because DNA and RNA have a very specific absorbance wavelength of 260nm, it is easy to determine whether the sample is contaminated with other compounds, such as proteins that have a lower absorbance spectrum, using a UV-vis spectrophotometer.
Color Analysis
Because UV-vis spectroscopy operates in the visible light spectrum, it can be very useful in determining the intensity of color in almost any solution — from food coloring to motor oil.
That’s because the intensity of color is, essentially, its absorbance spectrum. As a result, you can determine the concentration of a certain coloring agent in a solution by measuring how much visible light it absorbs within the corresponding wavelength range.
For instance, you can determine whether a blue food coloring is perfectly blue by running it through a UV-vis spectrophotometer to see whether it absorbs the light waves of 450-495nm — the range of the color blue on the visible color spectrum.
Features of the tec5USA UV-Vis Spectroscopy Solutions
tec5USA Ultraviolet-Visible (UV-vis) spectroscopy solutions are fast, precise and versatile. Our spectrophotometer is suitable for a wide range of applications and scenarios thanks to its high customization potential.
Depending on your needs, it can be equipped with several different light sources — a near-infrared shine-through lamp, a xenon flash lamp, or a halogen lamp. This allows the spectrophotometer to achieve a wavelength range of 190-2500nm.
The photodetectors are equally customizable, with CCD, CMOS, and NMOS sensors available for a variety of applications and the highest accuracy.
tec5USA UV-vis spectrophotometers support up to 32 communication channels for simultaneous analysis of multiple samples at multiple locations. Combined with their multi-component analysis capabilities and robust construction, tec5USA spectrophotometers are flexible UV-vis spectrometry solutions that perform well even in the most demanding environments.
UV-Vis Spectroscopy Takeaways
UV-vis spectroscopy is among the fastest, most accurate, and most cost-effective solutions for chemical analysis.
By leveraging the behavior of ultraviolet and visible light with different chemical elements via the Beer-Lambert Law, UV-vis spectroscopy can help you accurately determine the concentration of a certain compound in a solution.
Because of its accuracy and versatility, UV-vis spectroscopy is widely used in many industries and scenarios, from determining the amount of caffeine in green coffee beans to confirming the purity of a DNA/RNA sample during medical analysis.
Our tec5USA spectrophotometry solutions offer all of the benefits of this technology with the addition of high customizability and industrial-grade reliability. Explore our turnkey spectrometry solutions and discover the right tool for your chemical analysis needs.


